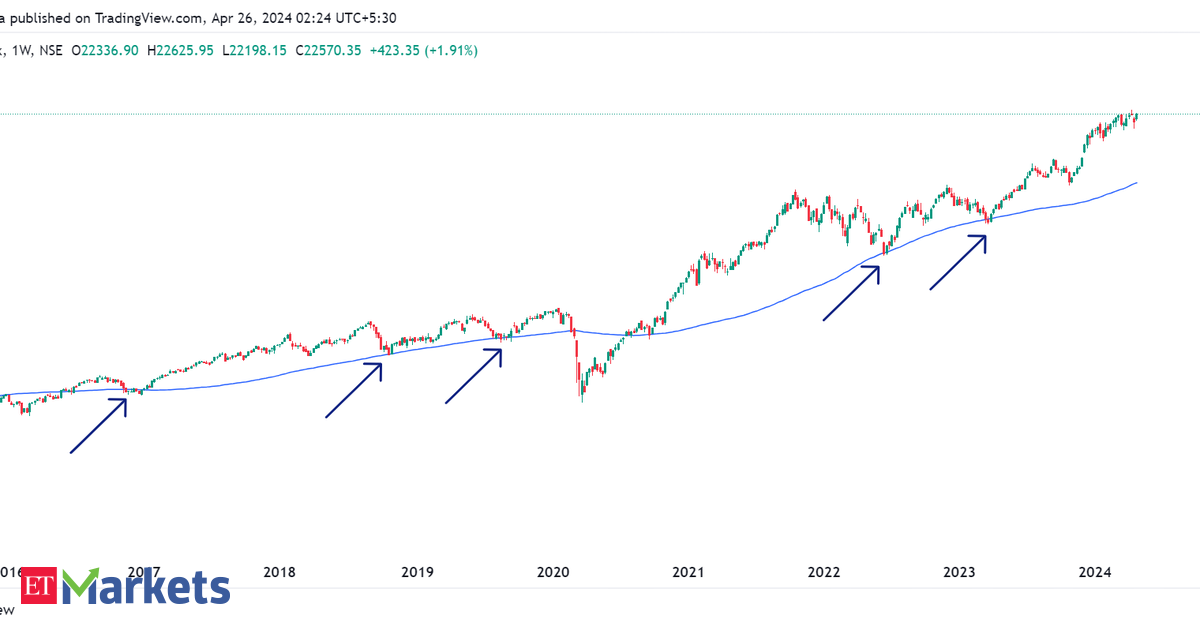
But how can we pinpoint the mean levels in markets? One effective method is utilizing moving averages. When employing moving averages, we can say that the index is in a bullish trend until its spot closes below the moving average line. We can observe a notable pattern in the Nifty 50 chart below, which spans a weekly timeframe and includes a plotted 100 Weekly Moving Average line. Following each bull run, the index retraces back to its moving average line before initiating another upward trend. This observation underscores the significance of moving averages in determining market trends and mean levels.
If we dive deeper, we might wonder how long a bull market lasts, how to know when it ends, and what are the returns following a bull run. The chart below showcases the continuous span of days the Nifty 50 remained above its 100-day moving average. Remarkably, between 2000 and 2024, the Nifty 50 has sustained a streak of closing above its 100-day moving average for more than 100 consecutive days on 18 occasions.
The table below displays the forward returns of the Nifty 50 index after it closes below its 100-DMA. Over the period from 1990 to 2024, there were 23 occasions where the index sustained a bullish trend for more than 100 consecutive days.
On average, these bull runs yielded returns of approximately 34%. It’s worth noting that the 1-month forward returns following the end of these bullish streaks tend to be negative, averaging at -1%. However, we can observe positive returns on 3-month and 6-month forward timelines, with average returns of 2% and 4% respectively.
Nifty 50 index has been on a bullish streak for more than 110 consecutive days since November 15, 2023. This aligns with historical trends of prolonged bullish sentiment. However, investors need to exercise caution and avoid assuming that the bullish phase will persist indefinitely. It’s prudent for investors to regularly review and churn their portfolios to mitigate the potential negative impacts of a shift to a bearish cycle, which could occur unexpectedly.
Nifty showed a notable upswing of 1.23% during the week and concluded the session at 22,420.
The decline in India’s VIX (10.92), a measure of market volatility, enhanced the bulls resulting in a positive market outlook.
Technically, Nifty sustains its position above the 20 and 50 Simple Moving Averages (SMA) with the Relative Strength Index (RSI) holding above 52 levels. The support level has shifted higher towards 22,150 followed by 22,100 while resistance stands around the previous all-time high of 22,751.
Along with large and mid-caps, the small-caps have also participated in this bull rally, strengthening the market breadth. The ongoing Q4 earnings results may spur more stock-specific actions in the coming sessions. The Global markets remained stable providing further support to the domestic market.